The most used mathematical model for modelling COVID-19
The SIR model is the most basic deterministic model of infectious disease dynamics. Navier-Stokes is to fluid models what SIR is to epidemiology. I suspect a lot of technically minded individuals are pinging the wikipedia page, before turning around because they don’t have time. The point of this post is to describe the SIR model in a couple paragraphs. Let’s go.
Variables
The variables of the model are
- \(s(t)\): the portion of the population susceptible to infection at time \(t\).
- \(i(t)\): the portion of the population currently infected
- \(r(t)\): the portion of the population recovered
Since each of these variables represents a portion of the population, each takes a value between \(0\) and \(1\). That the system is closed means
\[s(t) + i(t) + r(t) = 1\]We are ignoring the fact that people die in this model.
Dynamics
New infections are created by interactions between infected people and susceptible people. In the case of random interactions, the number of interactions is proportional to the product “\(i \cdot s\)”. Infections are destroyed as people recover, at some rate \(\gamma > 0\). If the rate of infection is \(\beta > 0\) then \(di/dt = \beta i \cdot s - \gamma i\). You can write down all this logic in the dynamical equations
\[\begin{align*} \frac{ds}{dt} &= - \beta i \cdot s \\ \frac{di}{dt} &= \beta i \cdot s - \gamma i \\ \frac{dr}{dt} &= \gamma i \end{align*}\]To study the dynamics, we can rescale time by the infection rate \(\tau := \gamma t\) and thus study the ODE
\[\begin{align*} \frac{ds}{d\tau} &= - R_0 i s \\ \frac{di}{d\tau} &= R_0 i s - i \\ \frac{dr}{dt} &= -i \end{align*}\]where \(R_0 = \beta / \gamma\). This is the “R-naught” that is being spoken of in any of those articles you might read that talk about “flattening the curve”. It’s also called the “basic reproduction number”. If \(R_0 > 1\) we get an epidemic, if it’s less than \(1\) we get exponential decay. In the case of covid-19, \(R_0 \approx 2.5\) without any intervention. In the (unrealistic) case where everybody without exception practices social distancing \(R_0 = 0\).
What could happen?
What could happen, qualitatively is illustrated in this plot
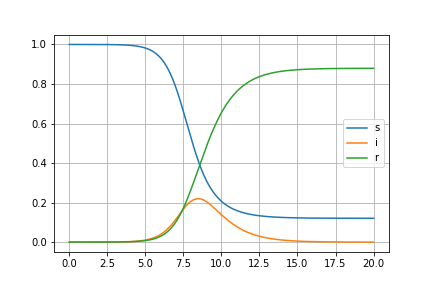
We have \(R_0 = 2.5\), and the plot suggests that at some point, 20 percent of people would be infected. Which is crazy. About 20% of that 20% (so 4%) will need hospitalization, and about a quarter of those in need of hospitalization will need ventilators (so 1%), which makes me feel a little sick to write. I’m not an epidemiologist, but my guess is that many of the projections that are being made by the experts are reasoning in a way that resembles what’s written here.